How to reduce Greenhouse gases emissions of the University of Lille?
CUMIN (C) March 2023
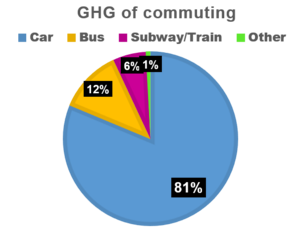
Thermal cars represent 81% of GHG emissions of the commuting mobility.
Several options are possible, among which are bikes and electric vehicles.
What is the distribution of University's GHG?
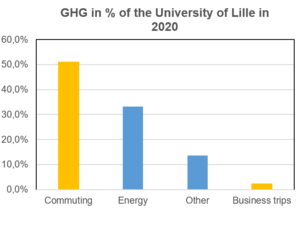
The assessment of the University of Lille's Greenhouse gases (GHG) emissions in 2020 is about 52 000 tons of CO2 equivalent [1]. Commuting represents 52% of them, energy 33% and professional mobility (including travels by plane) 2,3% only [2]. The reduction of all sectors' emissions is required but the ones due to commuting and energy is of higher priority.
What is the distribution of commuting's GHG?
In this carbon report, we see that thermal cars represent 24% of trips (in km) only, buses 12%, the remaining 71% are trips in subway/tramway/train. But, thermal cars [3] represent 81% of the GHG emissions of the mobility, and thermal bus 12%. On the Cité Scientifique campus (perimeter of the CUMIN program), it represents 5 000 vehicles per day, about ¼ for staff and ¾ for students.
How to reduce GHG emissions of commuting?
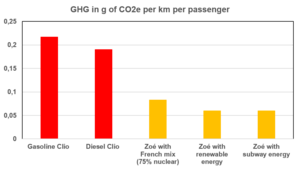
Compare to individual thermal vehicle (VT), several alternatives are possible according to home and each individual's specific needs. ADEME average emissions' factors [4] are used to compare options. Biking cancels mobility's GHG, but people usually do not use it for trips longer than 10km. Car sharing with 2 persons divided GHG emissions per 2. Electric vehicles (EV) divide GHG by more than 2 (see Appendix). Gas bus allows a gain of 45% only. Subway, tramway or local train are more efficient, but they require the development of long and costly infrastructures. Several options can be mixed together: EV and car-sharing, electric bus, multimodality (EV until subway station, then subway), etc.
The adoption of one of these options, or mix of options, by each thermal car driver will allow a significant reduction of GHG emissions of the University of Lille.
Thermal car represent 81% of GHG emissions of the commuting mobility. Several options are possible, among which are bike and electric vehicle.
Appendix – EV's GHG
EV's GHG depend largely on the way electricity is produced (see CUMIN fact sheet on vehicles' GHG). ADEME calculator [4] is quite general and gives average indicators. For thermal vehicle for example, there is no difference between gazoline and diesel vehicles.
CUMIN studied life cycle assessment (LCA) [5] [6], in a more refined way based on instrumented real vehicles (Renault Clio and Renault Zoe) with real driving cycles. The gain on EV GHG reduction is 62% instead of 55% from ADEME [7]. This study is based on the emissions of the French electrical production mix of the last 5 years [8]. In this specific case, when electricity is produced from local renewable energies (PV panels for example), this reduction will be around 72%. Moreover, CUMIN works with MEL on the reuse of subway's brake energy to supply EV charging stations [9]. Using this waste energy is also a way to reduce EV's GHG.
The energy consumption of a vehicle is globally proportional to its mass and the square of its speed (E= ½ M v²). For a same route (same speed), a mass is twice as large, asks twice energy (and produces about two times the among of GHG in its use stage). The seat-occupancy rate of public transportation is then crutial when it is about emitting less GHG: if a bus' mass is 10 times the mass of a car with the same fuel, an average of at least 10 passengers is required to reduce its GHG in the use stage. Furthermore, for all types of vehicles, and specially EVs, a reduced mass allows to reduce its comsumption, and then its GHG emissions in the use stage: SUVs (Sport Utility Vehicles) are then largest polluters than lightweight cars.
An EV charged with renewable energy or waste energy (subway braking energy) allows an important reduction of GHG.
References
[1] Bilan carbone de l’Université de Lille en 2020, rapport interne, 2020.
[2] La mobilité professionnelle calculée n’inclue pas celle des organismes (CNRS, etc.) ; mais même multipliée par 2 ou 3, sa part reste faible.
[3] On parle de véhicule thermique pour un véhicule à essence ou diesel ou gaz (combustion d’énergie fossile).
[4]“Calculer les émissions « carbone » de vos transport », ADEME, 2020 [Online, consulté en Mars 2023 https://agirpourlatransition.ademe.fr/particuliers/bureau/deplacements/calculer-emissions-carbone-trajets.
[5] L’Analyse de Cycle de Vie considère toutes les phases de la vie d’un véhicule : construction (dont extraction de ressources), usage (dont fabrication du carburant) et fin de vie (dont recyclage). L’indicateur de réchauffement climatique est lié aux GES (tonnes de CO2 équivalent).
[6] S. Kinle, A. Neef, “Life cycle management for transport and mobility”, Design sustainable technologies, products and polices, chapter 20, Edition Springer Open, 2018, DOI: 10.1007/978-3-319-66981-6_20.
[7] A. Desreveaux, A. Bouscayrol, R. Trigui, E. Hittinger, E. Castex, G. M. Sirbu, “Accurate energy consumption for comparison of climate change impact of thermal and electric vehicles", Energy, vol. 128, April 2023, ref 126637, DOI: 10.1016/j.energy.2023.126637 (L2EP, TVES, LTE-UGE, Rochester Inst. Tech. (USA), Renault Techn. Romania, within CUMIN and the PANDA H2020 project).
[8] Climate impact of electricity production, https://app.electricitymaps.com/map [On line]; consulted: March 2023.
[9] M R. O’Berriel, A. Bouscayrol, P. Delarue, C. Brocart, “Mechanical braking strategy Impact on energy consumption of a subway”, IEEE-VPPC’20, Gijon (Spain), December 2020 (common paper of L2EP Univ Lille and MEL, within CUMIN).
Nota : Lille 1 University completed its first carbon footprint assesment in 2010. It was updated in 2015 when those of Lille 2 & 3 Universities were realized for the first time. They all show the same trend regarding mobility's GHG.


