Does electric vehicle produce less greenhouse gases than thermal vehicle during the complete life cycle?
CUMIN (C) March 2023
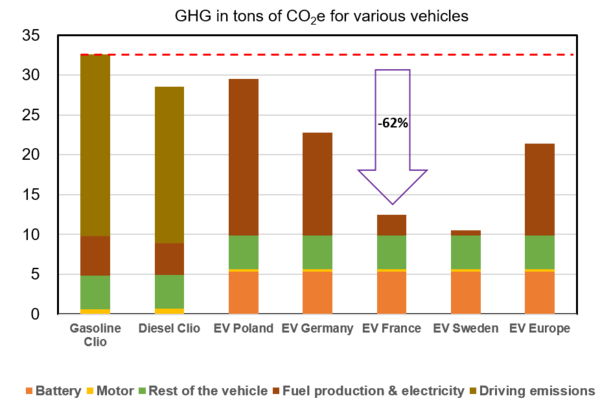
With the French electricity mix, GHG emissions are reduced by at least half for EV in comparison to those
of a gazoline or diesel vehicle with the same lifetime.
How to compare vehicles over time?
Life Cycle Assesment (LCA) takes into account all stages of vehicles' life: manufacturing (including extraction of resources), use (including manufacturig of fuel) and end of life (including recycling) [1]. In terms of climate change, the « Global Warming Potential » indicator is linked to GreenHouse Gases (GHG) and is calculated in tons CO2 equivalent.
Nota: Electric production (2018-2022) : Poland 70% coal, Germany 31% coal, France 70% nuclear, Sueden 80% reneawable
Which is the main source of emissions for EV?
To a large extend, the GHG emissions of an electric vehicle (EV) depend on the method of generating electricity [2]. Since 2017, various analyses have been made on EV's GHG according to the electricity production of countries [3].
Which GHG for which vehicle?
CUMIN took over these studies with more current parameters and new track cycles, more realistic. Two real vehicles were compared on a standard lifetime (150 000 km): diesel Renault Clio and electric Renault Zoé[4]. GHG emissions of various European countries' electricity production were taken into account [5]. Looking at the thermal vehicle of reference here, with the French electric mix, EV reduces GHG emissions by 62% despite the battery GHG additional cost. With the European mix (avarage electricity production in Europe), EV reduces GHG emissions by 38%.
Nota: ADEME calculator (different cycles) : 55% reduction of EV's GHG compare to an average thermal vehicle (petrol/diesel)
Does battery generate most of emissions?
Yes, during manufacturing and end of life but EV's gobal GHG are still lower than those of thermal vehicles.
Could CUMIN analysis be generalized?
Yes, it is confirmed by the following studies: Department of Energy (USA) [6], Joint Research Centre (Commission Européenne) [7], International Energy Agency [8] et ADEME en France [9], with some variations due to the use of different vehicles, routes, hypotheses or indicators [10].
Nota: Other LCA indicateurs ACV can be considered but there are not directely linke to climate warming
With the French electricity mix, GHG emissions are reduced by at least half for EV in comparison to those of a gazoline or diesel vehicle with the same lifetime.
Appendix – calculation of vehicles' GHG emissions by CUMIN
In order to compare GHG emissions of thermal and electric vehicles on new track cycles, CUMIN studied two comparable real vehicles: a Renault Clio and a Renault Zoe. It should be noted that only a few studies have compared vehicles from the same size range with measures on real track cycles.

Renault Zoé - Q90 41 kWh-2016 and Renault Clio III -1.5 dci 90 hp-2015 (diesel)
Process
1. Digital simulation models have been developed for each vehicle
2. These models have been validated in comparison to real vehicle tests on real track cycles.
The accuracy of models is over 97% for the energy consumption on different cycles.
3. Digital models assess the consumption of various track cycles (use stage).
4. GHG of manufacturing, use and end of life have been calculated for different case studies.
Results
Use stage depends on driving cycle and electricity production. Before 2018, standard driving cycle was NEDC cycle with weak accelerations and constant speed. Most of scientific studies are based on this cycle. Since 2018, standard driving cycle is WLTC cycle, more realistic. It is based on cycles' statistics. We also use real cycles measured on vehicles.
Nota: NEDC : « New European Driving Cycle », standard speed cycle, used in Europe from 1973 to 2018; WLTC : “Worldwide harmonized Light vehicles Test Cycle”, standard speed cycle, used worldwide since 2018
CUMIN has proved that the discrepancy for use stage's GHG between electril and thermal vehicles is weaker in a NEDC cycle (former) than in a WTLC cycle (new). GHG reduction thanks to EV is even more important in a real cycle (cycle measured on a vehicle).
The NEDC cycle, often used in industry and litterature, minimizes GHG reduction of EV[4].
References
[1] S. Kinle, A. Neef, “Life cycle management for transport and mobility”, Design sustainable technologies, products and polices, chapter 20, Edition Springer Open, 2018, DOI: 10.1007/978-3-319-66981-6_20.
[2] B. Marmiroli, M. Messagie, G. Dotelli, J. Van Mierlo, “Electricity generation in LCA of electric vehicles: a review”, Applied Sciences, vol. 8, n°8: 1384, 2018, DOI: 10.3390/app8081384.
[3] M. Messagie, “Life Cycle Analysis of the Climate Impact of Electric Vehicles”, Transport & Environment, 2017.
[4] A. Desreveaux, A. Bouscayrol, R. Trigui, E. Hittinger, E. Castex, G. M. Sirbu, “Accurate energy consumption for comparison of climate change impact of thermal and electric vehicles", Energy, vol. 128, April 2023, ref 126637, DOI: 10.1016/j.energy.2023.126637 (L2EP, TVES, LTE-UGE, Rochester Inst. Tech. (USA), Renault Techn. Romania, within CUMIN and the PANDA H2020 project).
[5] Climate impact of electricity production, https://app.electricitymaps.com/map [On line]; consulted: March 2023.
[6] A. Burnham, Z. Lu, M. Wang, A. Elgowainy, “Regional emissions analysis of light-duty battery electric vehicles”, Atmosphere, vol.12, no.11. ref 1482, 2012, DOI: 10.3390/atmos12111482.
[7] M. Prussi, M. Yugo, L. De Prada, M. Padella, R. Edwards. JEC Well-To-Wheels report v5. EUR 30284, European Environment Agency, 2022.
[8] “Comparative life-cycle GHG of a mid-size BEV and ICE vehicle, International Energy Agency, 2022 https://www.iea.org/data-and-statistics/charts/comparative-life-cycle-greenhouse-gas-emissions-of-a-mid-size-bev-and-ice-vehicle [Online] consulted in March 2023.
[9] “Calculer les émissions « carbone » de vos transport », Agence De l’Environnement de de la Maîtrise de l’Energie, 2020 [Online] https://agirpourlatransition.ademe.fr/particuliers/bureau/deplacements/calculer-emissions-carbone-trajets, consulté en Mars 2023.
[10] M. Messagie, F.S. Boureima, T. Coosemans, C. Macharis, J. Van Mierlo, “A range-based vehicle LCA incorporating variability in the environmental assessment of different vehicles and fuels”, Energies, vol. 7, 1467–1482, 2014, DOI: 10.3390/en7031467


